How to Teach Students to Spot Misleading Statistics
A student’s hand goes up mid-discussion, confident. “Seventy-three percent of teens say social media makes them more informed about politics. ChatGPT told me.” A beat of silence. The number sounds credible. The delivery is assured. Nobody in the room — including the teacher — can immediately tell whether that statistic comes from a Pew Research Center dataset or from a language model that assembled a plausible-sounding sentence the way autocomplete assembles a text message. So the discussion keeps moving, built on a number that may not exist.
That moment is not a discipline problem. It is not proof that students are careless or that they are doing something wrong. Every state that has rolled out media-literacy or data-literacy standards in the last three years has done so without handing teachers a single period of professional development or a single page of classroom materials to go with it. The mandate arrived; the curriculum did not. That gap is the problem, and it belongs to the system, not to you.
To teach students to spot misleading statistics, give them a short, repeatable check they can run on any number: trace it to a real source, read the axis and scale before the shape, and ask who was actually counted. In the AI era, add one move — because chatbots can invent confident numbers with fake citations, students verify a statistic against a real, named source before trusting it. A single 45-minute lesson pairs a misleading-graph hunt with an AI-generated-statistic test, anchored to CCSS.Math.Content.6.SP.A.2 and ISTE 1.3.b.
Why misleading statistics hit different now
Misleading data has been around as long as bar charts. A truncated y-axis, a cherry-picked time range, a self-selected internet poll — these are old moves. Every media-literacy teacher from 1998 forward has had a worksheet on them. What changed is the source.
A chatbot does not truncate an axis. It does something subtler: it produces a confident, grammatically perfect statistic — complete with a plausible journal name, a plausible year, and a plausible author — that cites a source that does not exist. According to data tracked by VKTR, the rate of measurable AI hallucinations in news-adjacent prompts rose from roughly 18 percent in August 2024 to roughly 35 percent in August 2025 (vktr.com). That is not a software glitch being patched away. It is an architectural feature of how large language models work.
Here is the one-paragraph explanation you can read aloud or project. Under AI4K12 Big Idea #3 — Computers and How They Learn — models are trained to predict the most plausible next token, not the most true one. They were rewarded, during training, for producing text that sounds right to a human reader. When a model does not have a reliable data point to retrieve, it does not stop. It generates a sentence that fits the statistical shape of an answer. That sentence often contains a real-looking percentage and a real-looking citation. The percentage was not calculated. The citation was assembled.
Meanwhile, the World Economic Forum’s 2025 Future of Jobs Report names analytical thinking as a top core skill, considered essential by roughly seven in ten companies for the workforce ahead (weforum.org). The students in a typical grade-6 classroom right now will enter that workforce. They need a check they can run in 90 seconds on any number they encounter.
States now mandate media and data literacy in their standards frameworks. Most of those mandates arrived without curriculum attached. The gap is real — and it is fillable with a single lesson structure that takes one class period.
How do you teach students to spot misleading statistics?

Teach one reusable, named check students can run on any statistic or graph, in any subject, for the rest of their lives. Call it the 3-S check: Source, Scale, Sample. Three questions, three moves, one protocol students can internalize before the end of a 45-minute period. Every section below gives the teaching language for one S.
Source — “Where did this number come from, and can I actually find it?”
The Source step is the first thing students run because it is the only step that catches AI-fabricated statistics entirely. When a chatbot invents a number, it often attaches a citation that sounds real — a journal name, a year, a researcher’s name. The test is simple: can a student find that source at a real URL or in a searchable database?
If the answer is no source found, the statistic does not go into the argument, the paragraph, or the discussion. Full stop.
This maps directly to CCSS.ELA-LITERACY.W.7.8, which asks students to gather relevant information from multiple sources and assess the credibility and accuracy of each. Traceability is the credibility test. A statistic that cannot be traced to a real, findable, named source does not pass.
Scale — “What is the axis or scale doing?”
The Scale step is the classic misleading-graphs-worksheet-middle-school skill, and it is worth teaching explicitly because visual distortion is invisible to a reader who trusts the shape of a graph before reading its numbers.
The five scale moves students watch for:
- Truncated y-axis (starts at 60, not 0 — making a 3-point rise look like a cliff)
- Stretched or compressed intervals (uneven tick marks on either axis)
- Missing zero baseline
- 3D perspective distortion (the tilt makes one bar look taller)
- Dual axes with different scales on left and right (the two lines seem to track together — they do not)
One projected side-by-side — the same dataset, honest axis versus truncated axis — takes four minutes and makes the distortion visible in a way no paragraph can.
Sample — “Who was actually counted, and how many?”
The Sample step catches the statistics that survive the Source check but still mislead. A real study, from a real journal, can produce a number that does not mean what it sounds like if the sample was small, self-selected, or systematically excluded a group.
Students ask three questions: How many people were in this study? Who was left out? Did those people choose to respond, or were they selected? A poll of 47 high school students who clicked a Twitter link is a real study. Its number is still nearly useless for a national claim.
ISTE 1.3.b — evaluate accuracy, perspective, credibility, and relevance of information, media, data, and other resources (iste.org) — names this exact move. Perspective means asking who was and was not counted.
A worked example: catching an AI-invented statistic

Running the 3-S check on a real-feeling AI output is the highest-transfer activity in this lesson. Here is a fully worked example a teacher can project or replicate with a class. Run the prompt first, before the lesson, because outputs vary.
A student types this prompt into any major chatbot: “What percent of middle schoolers use AI for homework? Cite a study.”
A typical response might read: “According to a 2024 study published in the Journal of Educational Technology and Behavior, 68 percent of middle school students reported using AI tools to assist with homework at least once per week.” The citation includes an author name, a volume number, and a page range. It sounds like a real abstract.
Now run the 3-S check.
Source: Search the exact journal name and study title in Google Scholar. Search the author name plus the publication year. When you run this with a class, there is a good chance the journal exists but the specific study does not — or the journal name is a slight variation of a real journal, which is its own lesson. In many cases: no results. The citation was assembled, not retrieved.
Scale/Sample: No methodology is given in the chatbot’s response. No sample size. No explanation of how “use AI for homework” was defined. Even if the source existed, the number would be unverifiable from the output alone.
Verdict: Unverifiable. Do not cite, do not repeat in discussion, do not include in writing.
A 7th-grade teacher can frame this as a class experiment rather than a gotcha: “We’re going to ask this question together, and then we’re going to check what comes back.” The moment the class cannot find the source in Google Scholar is the lesson. It lands harder than any lecture. For a deeper look at how AI invents citations and real classroom examples from published cases, the AI hallucination examples for grade 7 ELA post covers five verifiable cases with source links. The source evaluation companion for grades 6-8 extends the same skill into a full worksheet arc.
The 45-minute lesson, minute by minute
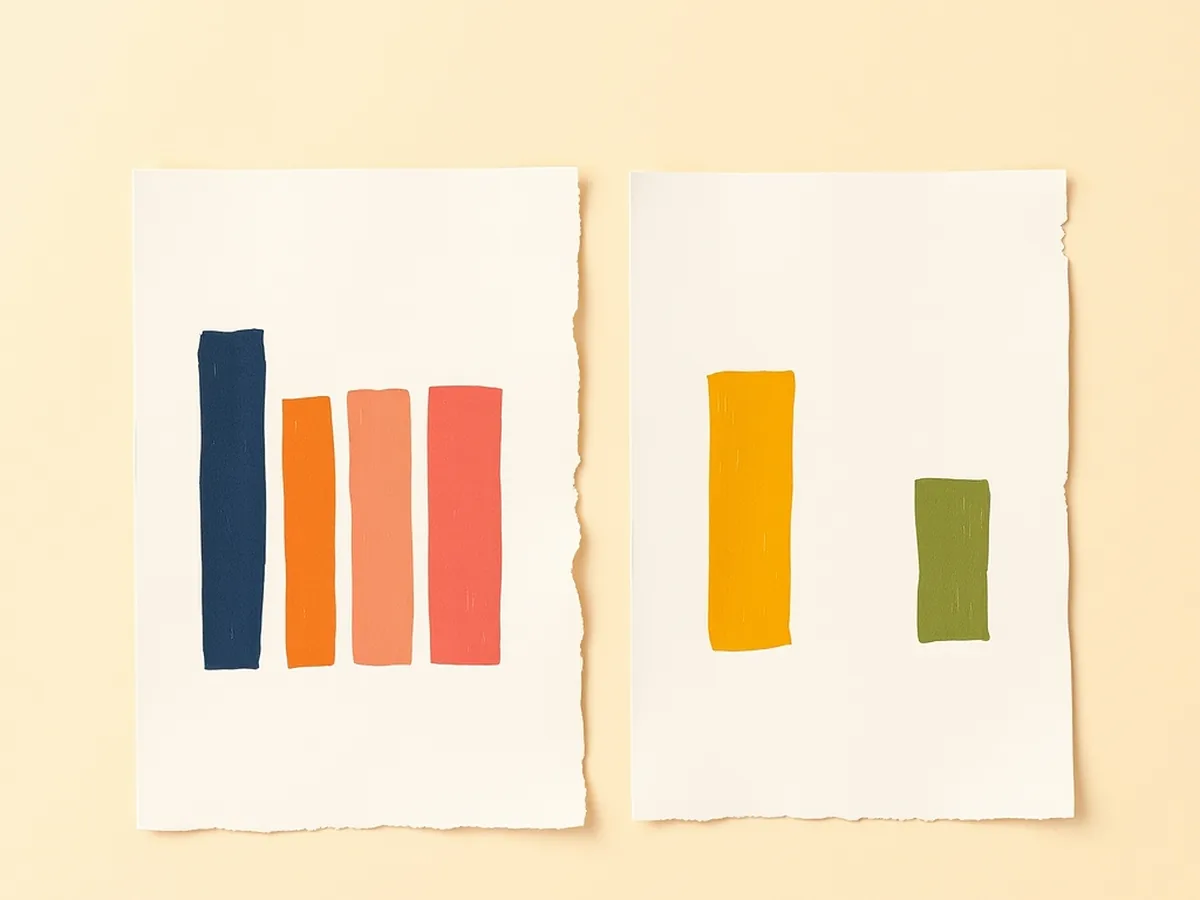
The whole lesson fits one class period. No technology required for the graph half — print the warm-up and the practice set. Here is the arc:
- 0-8 min — Opener: Project two versions of the same data side by side: an honest bar chart and the same data with a truncated y-axis. Ask students which trend looks bigger. Then reveal the axes. The mismatch between what they saw and what the data shows is the hook.
- 8-20 min — Mini-lesson: Introduce the 3-S check one letter at a time. One concrete example per S. For Source, show a real citation check in Google Scholar (30 seconds, live). For Scale, explain the five scale moves above. For Sample, show two headlines from the same real study with different framing.
- 20-38 min — Independent or partner practice: Students run the 3-S check on a mixed set of three items: one real statistic with a real source, one misleading graph with a truncated axis, and one AI-generated statistic with a fabricated citation. Students write the verdict for each — confirmed, distorted, or unverifiable — and one sentence explaining why.
- 38-45 min — Exit ticket: Each student writes the one question they will ask before trusting any number they encounter. Keep a class list of the responses. The variety is usually the richest discussion of the week.
For groups that move faster, add a fourth item: a real statistic from a real source that is still misleading because of sample exclusion. For groups that need more support, the graph warm-up works as a no-tech print activity while the AI-statistic section runs on one shared device at the front. This lesson does not need a district platform or an app subscription. A printer and a projector are enough. The AI in math class post covers the adjacent numeracy skills for teachers building a broader data unit alongside this one.
Which standards does this lesson cover?
The lesson crosses four standards frameworks in a single period. Here is the crosswalk by anchor code, mapped to the exact activity step where it appears:
| Standard (anchor code) | What it asks | Where it shows up |
|---|---|---|
| CCSS.Math.Content.6.SP.A.2 | Describe a data distribution’s center, spread, and shape | Scale and Sample steps; graph warm-up |
| CCSS.ELA-LITERACY.W.7.8 | Gather information from multiple sources; assess credibility and accuracy of each | Source step; AI worked example |
| ISTE 1.3.b | Evaluate accuracy, perspective, credibility, and relevance of data and media | Whole 3-S check; exit ticket |
| AI4K12 Big Idea #3 | Computers learn from data | Explanation of why AI produces plausible-but-wrong numbers |
Standards source: ISTE Student Standards. ISTE is a registered trademark of the International Society for Technology in Education. These resources are not affiliated with or endorsed by ISTE.
Ready-to-teach data-literacy lessons
The curriculum gap that leaves teachers explaining data literacy without a lesson plan is real. But it is fillable — here are three print-and-teach resources so the lesson above does not have to be built from scratch on a weekend.
AI Data Literacy Lesson — Spot Misleading Data (Grades 6-8) is the direct companion to this post. It includes the misleading-graph warm-up, the 3-S check student reference card, the mixed practice set, and the exit ticket — fully scripted and ready to print.
AI Big Data Lesson — Data Visualization Ethics (Grades 6-8) extends into the ethics layer: who decides how data is visualized, and what is lost when the design choices obscure the truth. Pairs well as a Day 2 after this lesson’s Day 1.
AI Data Ethics 3-Lesson Pack — Privacy, Consent, Ownership (Grades 6-8) is the full unit for teachers who want to go further: three lessons covering how data is collected, who owns it, and what consent means when the collector is an algorithm. A complete standalone mini-unit.
All three are PDFs, ready to print. The lesson above already exists as a curriculum; you do not need to build it.
This post was drafted with AI assistance and human-finalized.
Quick questions
Teach one reusable 3-question check students run on any number: trace it to a real source, read the axis and scale before the shape, and ask who was actually counted. Then practice on real misleading graphs and one AI-generated statistic so students see how a confident-sounding number can still be wrong.
Yes. Large language models can produce fabricated numbers and cite sources that do not exist — a behavior called hallucination. News-prompt hallucination rates rose from roughly 18% to 35% between 2024 and 2025, which is exactly why students need a verify-before-you-trust habit.
It maps to CCSS.Math.Content.6.SP.A.2 (describing a data distribution), CCSS.ELA-LITERACY.W.7.8 (assessing source credibility and accuracy), and ISTE 1.3.b (evaluating the accuracy, credibility, and relevance of data and media).
Get the free AI-Proof Assignment Toolkit
10 ways to redesign any assignment so an AI chatbot structurally can't do it — plus a redesign worksheet, a 45-minute lesson, the “Spot AI Work” card, and parent templates. One email, all 5 pieces.
Prefer the full breakdown? See everything inside the toolkit →