How AI Navigation Apps Predict Traffic: A No-Device Lesson
A student in the back seat of the carpool van points at a parent’s phone and asks: “How did it know there’d be traffic before we even left?” The parent doesn’t know. The next morning, you’re standing at the whiteboard and one of your sixth graders asks the same question — except now it’s your job to answer it. The honest truth is that nobody handed you the curriculum for how AI navigation apps predict traffic. That gap is real, and this post closes it in one period.
TL;DR: How AI navigation apps predict traffic comes down to four steps working together. Apps like Google Maps collect anonymized speed and location data from phones running the app — hundreds of millions of data points per day. That live feed gets blended with historical traffic patterns for the same road at the same hour. A graph neural network then treats connected road segments as a network, scores the likely speed for each segment, and predicts travel times across possible routes. Finally, a routing algorithm picks the fastest current path. The system fails when fresh data dries up — a road closed in a blizzard has no recent speed signals, so the model falls back on stale history and routes people into the storm.
How does Google Maps predict traffic?
The mechanism has four stages, and every one of them is teachable to a sixth grader.
Step 1 — Collect. Every phone running Google Maps (or Waze) with location services on sends back anonymized speed and position data in real time. Google has described this as aggregating data from hundreds of millions of devices globally. The phone doesn’t report your name or your destination — it reports: a device at this location is moving at this speed.
Step 2 — Blend. That live feed is merged with historical traffic patterns for the same road, the same day of the week, the same hour. A Tuesday at 7:45 a.m. on a given stretch of highway has a signature that the system has seen many times before. Historical pattern + live signal = a richer picture than either alone.
Step 3 — Predict with a graph neural network. In September 2020, DeepMind and Google published research on how a graph neural network (GNN) handles traffic prediction at scale. Road networks are graphs — intersections are nodes, road segments are edges. The GNN groups connected segments into what the researchers called “Supersegments” and predicts travel speed across the whole cluster, not just for isolated stretches. According to DeepMind’s published findings, this approach cut inaccurate estimated time-of-arrival (ETA) predictions by up to 50% in tested cities. Google separately reports that ETAs are now accurate for over 97% of trips. Sources: DeepMind — Traffic prediction with advanced graph neural networks and Google Maps 101 — how AI helps predict traffic.
Step 4 — Route. A routing algorithm takes the predicted travel times and selects the fastest current path from origin to destination. This updates continuously — every few minutes, new crowd-sourced data changes the prediction, and the suggested route may shift.
Four steps. Four minutes of board explanation. Every single step maps to a standard students are supposed to hit.
This is not a self-driving car
Students mix up two very different things: AI that predicts where traffic will be versus AI that drives a car through it. Worth naming the distinction explicitly before the Road Graph Game below, so students don’t conflate “the phone knew” with “the phone drove.”
Navigation AI runs on a server (and in the app) and does two things: predict traffic conditions across a road network, then calculate the fastest route. It has no control over the vehicle. It cannot steer, brake, or accelerate. The car’s driver makes every physical decision.
Self-driving vehicle AI is a separate, far more complex system — it fuses camera, radar, and LiDAR sensor data in real time, classifies objects in the vehicle’s path, and sends actuation commands to steering and brakes. A navigation app doesn’t know what’s physically in front of the car. A self-driving system doesn’t care what the traffic is like three miles ahead until it gets there.
If you’ve already run the self-driving car unplugged activity, this is the moment to tell students: “We did the sensor-fusion pipeline last time. Today we’re doing the network-prediction layer above it — a completely different AI running in a different place.”
The distinction matters for standards, too: the self-driving car lesson grounds in AI4K12 Big Idea #1 (Perception — sensors reading the physical world). Traffic prediction grounds in AI4K12 Big Idea #3 (Learning — patterns learned from historical + crowd-sourced data). Same ecosystem of AI in transportation, different jobs.
Where the prediction breaks: a snowstorm reroute

The most useful thing you can teach about any AI system is not what it does well — it’s exactly where it fails and why.
In December 2021, a severe blizzard hit the Lake Tahoe region. Travelers heading from Sacramento toward Reno reported that Google Maps was routing them onto narrow, poorly maintained forest roads — not the main highway. Climate scientist Crystal Kolden publicly warned that the app was directing drivers “up a poorly maintained forest road” in dangerous conditions. The story was covered by tech news outlets at the time (PhoneArena, Dec 2021).
Why did it happen? The crowd-sourced signal collapsed. Almost no one had driven that forest road recently in storm conditions, so the app had no fresh speed data for it. Meanwhile, the highway — the correct route — was jammed and reporting slow speeds. The model did exactly what it was trained to do: find the path with the fastest predicted travel time. Without recent data from the closed or nearly impassable forest roads, it estimated them as fast. Historical patterns showed them as uncongested. The algorithm followed the data it had.
This is the failure pattern students need to name: the model was working correctly on wrong inputs. No data corruption. No malfunction. The system performed exactly as designed — and that design assumption (crowd-sourced data is always flowing) broke down in an emergency. Similar dynamics have been documented in other countries, sometimes with far more serious outcomes; the Tahoe case is the cleanest teachable example because the mechanism is clear and no credible source disputes it.
This maps directly to AI4K12 Big Idea #5: AI can fail in unexpected ways, and those failures can have real societal consequences. It’s also the natural setup for the discussion question in the privacy section: if the system needs crowd-sourced location data to work safely, what does that mean for users who opt out?
The privacy trade: what “anonymized” really means
The crowd-sourced model that makes traffic prediction possible raises a question worth spending five minutes on: what exactly gets collected, and who controls it?
Google describes the data as “anonymized” — meaning the app does not attach your name or account to the location signal. What it does collect is the device’s movement (speed + position), time-stamped, aggregated with millions of others. In practice, research on de-anonymization has shown that even aggregated location data can sometimes identify individuals from movement patterns, particularly for users with distinctive routines. The relevant question for students is not whether a company is lying — it’s whether “anonymized” is a binary guarantee or a point on a spectrum.
A straightforward discussion question for your class: If you turn off location sharing to protect your privacy, does that make traffic prediction safer or less safe for everyone driving that road in a storm?
That question doesn’t have one clean answer. That’s the point. It hits ISTE 1.2.d directly — students managing their personal data and making informed decisions about digital privacy — without positioning the technology as purely dangerous or purely fine.
Keep this section balanced. The goal is a discussion, not a verdict. Students who reach their own reasoned position on the tradeoff will remember it longer than students who are told what to think.
Teach it in 45 minutes: the Road Graph Game (no devices)
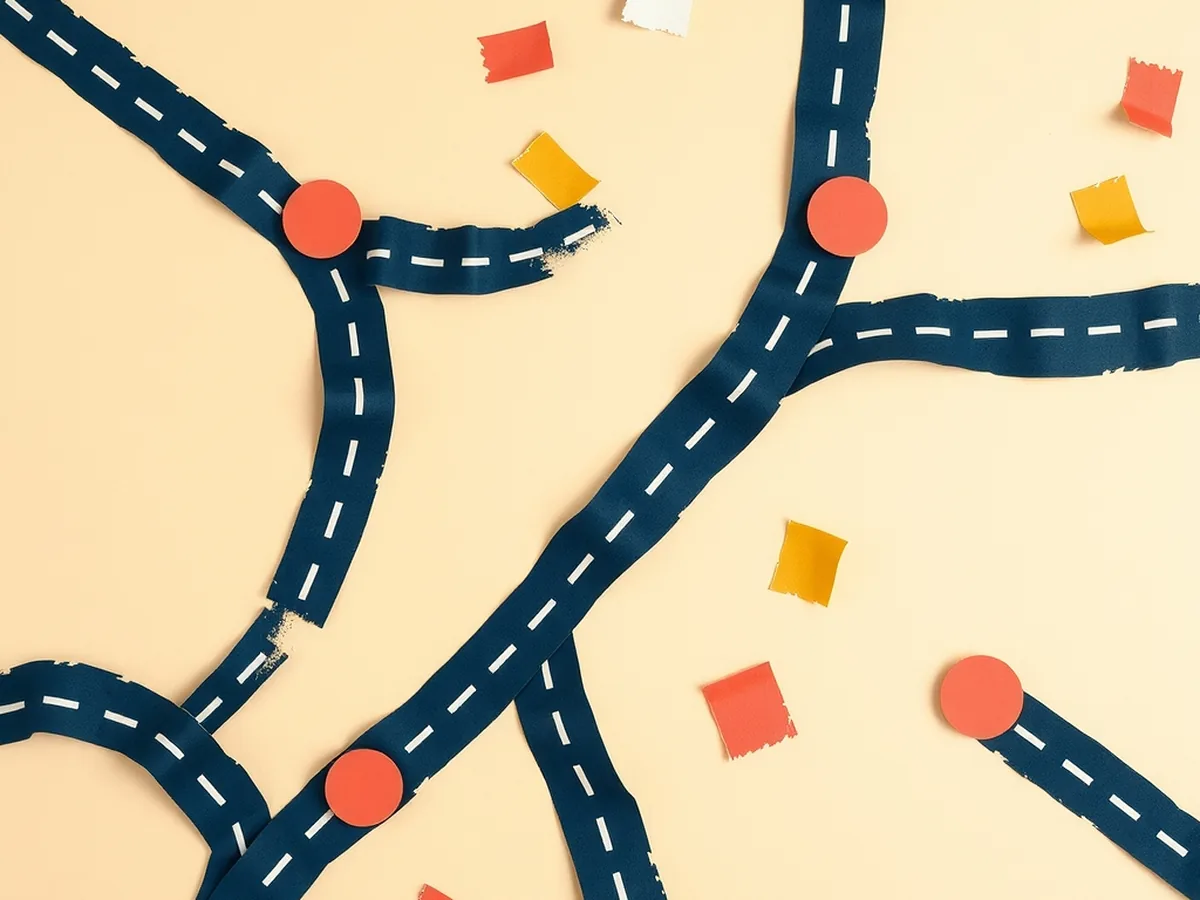
This is the core activity — a fully no-device simulation that teaches graph-based routing and the failure mode in a single class period. You’ll need index cards, a few markers, and enough floor or desk space for students to stand as nodes.
Setup (0–8 min)
Draw a road network on the board: six “cities” (nodes), eight “roads” (edges). Label each road with a travel time in minutes — these are the index cards students will carry as “edge weights.” Assign six students to be nodes (they stand and hold their city name). Remaining students are “travelers” who will trace routes by physically moving along the graph. Introduce the rule: the router always picks the path with the lowest total travel time from origin to destination.
Round 1 — Base routing (8–22 min)
Call out an origin and destination. Travelers trace possible paths and add up the times on each edge card. The class votes on the fastest route. Run two or three origin-destination pairs so students get the pattern: adding edge weights along a path is exactly what the routing algorithm does, repeated across millions of road segments every few minutes.
Common student mistake in Round 1: students try to minimize the number of road segments (hops) rather than the total travel time. The fix is to run one example where the short-hop path is actually slower — say, a two-road direct route that totals 40 minutes versus a three-road path totaling 22 minutes. The data wins. Number of steps doesn’t matter; cost does.
This is ISTE 1.5.c in action: students break the problem into parts (individual road segments) and build a model (the paper road network) to test it.
Storm round (22–35 min)
Without announcing it to travelers, quietly fold one “road” edge card in half and turn it face-down. That road is now closed — but the travelers don’t know because no one has driven it in the last hour to report the closure. Run the next routing round. Watch what happens: the router (working from the last known state of the network) picks the fastest path using stale data, which includes the now-closed road. Travelers “arrive” at a blocked road and have to reroute mid-trip.
Debrief questions for the storm round:
- What information did the router not have?
- Who would have needed to be on that road recently for the system to know it was closed?
- What would have to be true about the road for no one to have driven it?
The storm round is the Tahoe blizzard, in miniature. Students feel the failure before they read about it. That sequence — feel it, then name it — is what makes the mechanism stick.
Debrief (35–45 min)
Return to the board. Draw the four-step mechanism (Collect → Blend → GNN → Route). Ask students to point to which step the storm round broke. Almost every class lands correctly on Step 1: the collection signal failed, so everything downstream was running on bad inputs. Cite ISTE 1.5.d (algorithmic thinking — understanding how a systematic process produces outcomes) and close with the AI4K12 framing: What would it take to make the system more resilient to this failure? That question has no single answer and is a good exit-ticket prompt.
A typical class finishes the full arc in 42–45 minutes. Teachers who want to go deeper with a second period can pair this with the 10 no-tech AI lessons in the Unplugged AI Activities pack, which extends the graph-traversal concept across additional contexts including sorting and classification.
Standards crosswalk
This table maps each phase of the Road Graph Game and the surrounding discussion to specific anchor codes. Every code below is pre-verified.
| Activity phase | Standard anchor code | What it covers |
|---|---|---|
| Collect step — phones sense road speed | AI4K12 Big Idea #1 (Perception) | AI perceives data about the world through sensors (here: location + speed via device) |
| GNN learns from historical data | AI4K12 Big Idea #3 (Learning) | Computers learn patterns from large datasets; here: historical traffic by road + hour |
| Tahoe blizzard failure mode | AI4K12 Big Idea #5 (Societal Impact) | AI can fail in unexpected ways with real consequences |
| Round 1 — base routing | ISTE 1.5.d (Algorithmic Thinking) | Students understand how systematic processes (path-cost addition) produce outcomes |
| Storm round — break problem into parts | ISTE 1.5.c (Computational Thinker) | Students break routing into segments and build a paper model to investigate it |
| Overall lesson — real-world issue exploration | ISTE 1.3.d (Knowledge Constructor) | Students actively explore a real-world issue (traffic AI) to build knowledge |
| Privacy trade discussion | ISTE 1.2.d (Digital Citizen) | Students manage and make informed decisions about their personal location data |
| Full-class routing debrief | CCSS.ELA-LITERACY.SL.7.1 | Students engage in collaborative discussion, building on each other’s reasoning |
| Evaluating the Tahoe source | CCSS.ELA-LITERACY.W.7.8 | Students gather information from sources and assess credibility and accuracy |
Standards source: ISTE Student Standards. ISTE is a registered trademark of the International Society for Technology in Education. These resources are not affiliated with or endorsed by ISTE. AI4K12 is a national initiative; Big Idea anchor codes used per the published framework.
Where to go from here
This is one of the more satisfying lessons to run because students come in with a daily-life assumption — the phone just knows — and leave with a four-step mechanism they can name. The gap between “it just knows” and “here’s the actual pipeline” is exactly what AI literacy is for, and it’s exactly the gap that nobody packaged into a teachable format and handed to middle-school ELA and social studies teachers.
You don’t have to build this from scratch. The How AI Works MEGA bundle covers 16 AI concept lessons — including the graph-based and network learning concepts that underpin traffic prediction — with scripted teacher guides, student worksheets, and answer keys. If today’s post made you want to run more no-device lessons across the rest of the unit, the Unplugged AI Activities pack (10 no-tech lessons) is the companion resource — role plays, card sorts, and paper simulations that teach the same AI concepts without requiring a device per student.
If you’re new here, the free Starter Pack has a no-prep AI literacy lesson you can run this week while you decide what comes next. This post is also part of the broader how-AI-works series — the previous episode explains how AI reads handwriting, with a similar unplugged pipeline role-play that pairs naturally with today’s Road Graph Game.
The curriculum gap is real. It’s also fillable — one mechanism, one lesson, one class period at a time.
This post was drafted with AI assistance and human-finalized.
Quick questions
Four steps working together. Apps like Google Maps collect anonymized speed and location data from phones running the app, then blend that live feed with historical traffic patterns for the same road at the same hour. A graph neural network treats connected road segments as a network and predicts each segment's likely speed. Finally, a routing algorithm picks the fastest current path. The prediction updates every few minutes as new crowd-sourced data arrives.
Because the prediction is only as good as its most recent data. When a road has no fresh speed signals — say a forest road nobody has driven during a blizzard — the model falls back on stale historical patterns and can route drivers into danger. In the December 2021 Lake Tahoe snowstorm, drivers reported being sent onto narrow, poorly maintained forest roads because the app had no live data showing those roads were impassable.
No. A navigation app predicts traffic and calculates the fastest route, but it has no control over the vehicle — it cannot steer, brake, or accelerate. A self-driving system is a separate, far more complex AI that fuses camera, radar, and LiDAR data to physically drive the car. The navigation layer runs on the phone; the driving layer runs in the vehicle.
Get the free AI-Proof Assignment Toolkit
10 ways to redesign any assignment so an AI chatbot structurally can't do it — plus a redesign worksheet, a 45-minute lesson, the “Spot AI Work” card, and parent templates. One email, all 5 pieces.
Prefer the full breakdown? See everything inside the toolkit →